

When you first start studying astronomy, it might not be very clear. What is the best way to find the constellations? How do you learn to recognize the stars?
A star chart can not only let you explore the heavens, but it can also help you in finding interesting objects along the way. Fortunately, a map of the stars functions similarly to a map of the Earth!
Table of Contents
What is the purpose of a star chart?
Have you ever stood beneath a starry sky and had no idea what you were looking at? Perhaps you’re already familiar with the Big Dipper and want to learn more. Or perhaps you’re already acquainted with the constellations and want to go further.
This is where a star chart comes in handy. Learning how to read a star chart is just as important as learning how to use your telescope equipment because you won’t be able to navigate the sky without one. This article will review the fundamentals, explain how to interpret a star chart, and make the most of it.
What is a star chart or star map?
A star chart is a diagram of the heavens. A map of the sky will show you the constellations and their stars, just as a map of the Earth will show you the different countries and towns. A terrestrial map, for example, will show the locations of lakes, mountains, and volcanoes, whereas a celestial chart will show the positions of nebulae, star clusters, and galaxies.
Furthermore, a night sky chart employs a grid reference system – similar to longitude and latitude on maps of the Earth – that can assist you in readily locating and identifying hundreds of prospective observing targets.

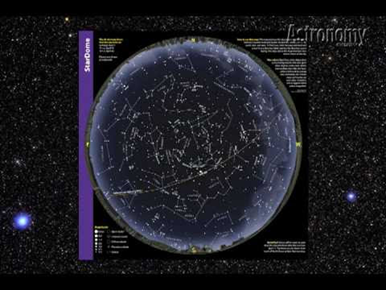
What does a star chart look like?
Normally, a star chart only depicts what can be seen with the naked eye under a dark sky. It’s comparable to a planisphere, although they’re used for different things.
Stars are portrayed as black dots on a white background, making them easier to read at night. The star’s brightness is reflected in the size of the dot; the larger the dot, the brighter the star.
In addition to the dots, there are gray circles that represent star clusters and ovals of galaxies. Because not every object in the night sky is represented here, astronomers use these brighter objects as references for star hopping to fainter ones.
The Milky Way is also frequently depicted as an outline or slightly grayed-out expanse.
Elements of a star chart

Whatever the format, chart creators have several options:
- Dark or light background? It appears more natural with a black or dark blue background and white dots for stars. However, a white backdrop with black dots for stars is easier to print and allows users to add notes.
- Lines or no lines? Guidelines can connect the stars to form shapes that draw the eye from one star to the next. Traditional and widely used shapes include the Great Square of Pegasus, the Big Dipper, the three stars of Orion’s Belt, and others. However, you are free to make up your stick figures if they help you find your way.
- How big and small should the star dots be? Big dots represent brighter stars, whereas small dots represent fainter stars. It takes skill to create a graded set of star dots that accurately represents the range of brightness in the real sky.
- Constellation figures or none? Some star charts, particularly those from the 1600s to the early 1800s, such as those found in art books or as vintage decorative items, portray a wild party of legendary figures swimming throughout the sky, ranging from Andromeda to Vulpecula. Some are unforgettable, while others are perplexing. The figure of Orion, for example, is easy to visualize in the constellation’s pattern of two shoulder stars, three belt stars, and two stars for feet or knees. However, attempting to build the Greater Bear, Ursa Major, out of the Big Dipper and surrounding stars can be difficult.“The Sidereal Heaven and Other Subjects Connected with Astronomy” (Edward C. Biddle, 1842), a popular astronomy book released in 1842, author Thomas Dick depicts legendary constellation depictions as “grotesque and discordant images… ugly, ludicrous, and unreal objects.” Star charts began to eliminate mythological features in favor of stick figures or the straight-line borders between constellations agreed upon by the International Astronomical Union in 1930.
- Planets or no planets? When viewed from Earth, Mercury, Venus, Mars, Jupiter, and Saturn appear bright stars. They can appear anywhere in the zodiac, along a ring that wraps around the sky. A star chart created for a certain month in a specific year may display the planets’ positions for that month.
Constellations are necessarily stretched near the borders of full-circle charts, just as distant continents are stretched on Earth maps. (For example, Mercator projection rectangular world maps make Antarctica and Greenland appear much larger than they are.)
How to read a star chart
If you’re unfamiliar with star charts, they may appear like a jumbled mess of dots, lines, and forms. They are, nevertheless, far simpler than they appear. For everything to make sense, you only need to know a few things. When viewing a map at night, use a red torch to avoid impairing your night vision. A black and white star map will suffice because a red torch will not allow you to see colors.
Circles
Circles on star charts depict stars. To illustrate the brightness of stars, most star charts use different-sized circles. As you might expect, the largest circles contain the brightest stars, which remain visible regardless of the quantity of light pollution. The smallest circles include the weakest stars, which can only be seen in a rural sky.
Some star charts contain a broader range of circle sizes, including very faint stars that can only be viewed under particular conditions or with a telescope or binoculars. These charts are ideal for individuals who want to learn more about the sky.
Constellation lines
You’ll observe lines connecting some stars on a star chart. These depict the general shape of a constellation. Depending on the map, these may depict the brightest asterism within the constellations, such as the Summer Triangle or the Big Dipper. While the limits of each constellation are precisely defined, the manner the stars are linked may differ from chart to chart.
Multiples and variables
Variable stars vary brightness over time, brightening and fading at different times of the year. Because these stars are particularly appealing to stargazers, they are frequently labeled differently on star charts.
On a star chart, the following sorts of stars are usually labeled differently:
- Multiple stars
Some multiple stars, such as Alcor and Mizar in the Big Dipper’s handle, are two stars far enough apart to be indicated separately on the star chart. There is no need to use a specific symbol in this scenario. A black dot is placed on top of another black dot if multiple stars overlap. The smaller dot in this scenario normally has a white border.
However, in most cases, numerous stars are too close to be marked on the chart. In this situation, the star is given a new name. It’s marked as a dot with a line through it rather than a conventional dot. Because Alcor and Mizar are both double stars, they have a line through them.
- Variable stars
Variable stars are those whose brilliance varies. A dot inside a circle usually depicts these. The size of the outer circle symbolizes maximum brightness, while the size of the dot inside represents a minimum. The star will sometimes be brilliant enough to fill the circle, while other times, it will be as faint as the inside dot.
Coordinate lines
Coordinate lines are included in certain star charts. These aid navigation by allowing you to find a faint fuzzy more precisely. The coordinates of right ascension and declination are sometimes marked on a star chart.
On Earth, these are equivalent to longitude and latitude. These measurements, known as RA (right ascension) and dec (declination), mark the position of a star in the sky using two points: the celestial equator – a line in the sky immediately above the Earth’s equator – and the First Point of Aries – located in the constellation of Pisces.
Dec is measured in degrees and indicates the distance between the star and the celestial equator. When a star has a declination of –52°41′, it implies that it is many degrees south of the celestial equator.
The angular distance on the celestial equator from the First Point of Aries is measured as RA. Instead of degrees, this angle is measured in hours, minutes, and seconds, with a complete cycle around the Earth taking 24 hours. When a star has a RA of 06h24m, it signifies that the RA coordination is somewhat more than one-quarter of the way around the Earth from the First Point of Aries.
What are right ascension and declination?
Earth maps employ a coordinate system known as latitude and longitude to record the precise location of a town, city, or landmark on the Earth’s surface. Latitude describes how much North or south of the equator a location is, while longitude indicates how far east or west of Greenwich, England.

An illustration of latitude and longitude on the Earth.
A star map functions similarly to a latitude map, but instead of latitude, there is declination, and instead of longitude, there is right ascension. We’ll return to these phrases shortly, but one more significant distinction is to be aware of.
When you look at the globe of the Earth or a map, you’re looking at it from above rather than standing on its surface.
When you look at a star map, the reverse is the case. You’re looking up at a sphere instead of down at one since we’re standing on Earth and staring at the sky. In reality, the ancients believed that the stars were attached to a sphere encompassing the Earth.
Although this is not strictly correct, it is a good way to think of the sky, and astronomers continue to refer to the sky above as the celestial sphere.
So, when astronomers began plotting star positions, they needed a way to designate where a star may be found on the celestial sphere. It only seemed reasonable to base that system on the maps of the Earth that already existed.
A star map, as we taught, employs declination rather than latitude. Latitude is indicated in degrees on maps of the Earth and can range from -90 to +90. Sites in the southern hemisphere are denoted by negative values, whereas positive values denote locations in the northern hemisphere. The equator, of course, has a value of zero.
The same is true for declination on a star map. Declination is also measured in degrees, with a negative number indicating a location in the southern celestial hemisphere and a positive value indicating a location in the northern celestial hemisphere. Similarly, the celestial equator is represented by a value of zero.
Degrees are subdivided into arcminutes (from 0 to 60) and arcseconds (from 0 to 60). However, it is important to remember that neither arcminute nor arcsecond number will reach 60 because that would be technically zero. (Similarly, minutes and seconds on the clock progress from 59 to 0).
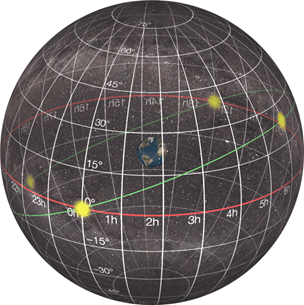
The celestial sphere, depicting R.A. and Dec
The celestial equivalent of longitude operates in a somewhat different manner. Longitude is also measured in degrees on maps of the Earth, with values ranging from -180 to +180. Sites west of Greenwich, England, are denoted by negative values, whereas positive values denote locations east of Greenwich.
The prime meridian, an invisible line from pole to a pole that passes through the Royal Observatory in Greenwich, is properly known as zero degrees longitude. (Greenwich is a London borough, and the observatory is still there.) Visitors can stand on the meridian with one foot in the east and one foot in the west!
The main difference is that a star map uses the right ascension, measured in hours, minutes, and seconds rather than degrees. Because the celestial sphere takes about 24 hours to rotate above us, the right ascension can range from 0 to 24.
(Theoretically, no object has a right ascension of exactly 24 hours because that would reset to zero, just as a clock would go from 23:59 to 00:00.)
On a star chart, zero hours, zero minutes, and zero seconds (also known as zero hours) is the point at which the Sun passes over from the southern to the northern celestial hemispheres and lies exactly on the celestial equator. This occurs only once a year, in late September, at the vernal equinox.
The constellation of Pisces currently has zero hours right ascension and zero degrees declination. (It will shift over millennia, but that is a topic for another day!)
Finally, the right ascension is frequently shortened as R.A. and written as XXh XXm XXs, where h is hours, m is minutes, and s is seconds. Declination is abbreviated as Dec and written as XX° XX’ XX,’ where ° is degrees, ‘ is arcminutes, and ‘’ is arcseconds.
How do you find objects on a star chart?
The right ascension and declination will be printed at the top and bottom of a star chart, and the right ascension and declination will be printed along the sides. The chart will look like a grid, with vertical lines representing right ascension and horizontal lines representing declination intersecting.
You can find an object on the chart by knowing its right ascension (R.A.) and declination. For example, Sirius, the brightest star in the sky, has an R.A. of 06h 46m 06s and a declination of -16° 44′ 19″. It is in the celestial southern hemisphere because its declination is less than zero.
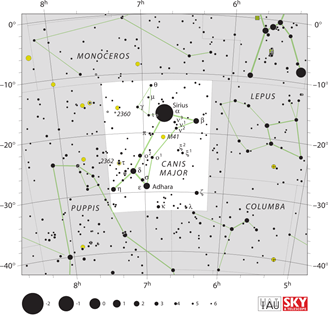
When referring to a star chart, we look for the horizontal lines signifying -10 and -20 degrees declination along the right side. Then we can glance to the left until we reach a vertical line representing 6 hours of right ascension. The star Sirius can be found in the box created by this line and the line for 7 hours of right ascension.
But, exactly, what are you looking for?
What can you find on a star chart?
Black dots of varied sizes represent stars according to their magnitude. Simply put, magnitude measures a star’s brightness, and the larger the dot on the star chart, the brighter the star.
Single stars are represented by a single black dot, while double stars are represented by two black dots connected by a line. Variable stars, or those whose brightness changes over time, represent a black dot within a circle.
Open star clusters are portrayed as a dotted circles, while globular star clusters are circles with a central cross that divides the circle into four halves.
Diffuse nebulae are portrayed as the shape of the sky, while planetary nebulae are depicted as circles with four protruding lines. Finally, ellipses are used to symbolize galaxies.
What is a planisphere?
All of this is good if you already know the constellations and where to look for them, but what if you don’t? A planisphere can help in this situation. This unique star map depicts the sky as seen from a certain location and at a specific time.
A planisphere is circular because it shows the entire sky, with the cardinal points of North, east, south, and West along the edges.
A conventional planisphere consists of two discs: the star map and a mask covering the map and concealing any stars that cannot be seen. A circular window in the mask allows you to view which stars are quite visible.

Dates will be written along the map’s edge, while the hours of the day will be written on the mask. Turn the discs, so the current time and date are aligned to see which stars are visible.
It is critical to note that you will require a planisphere to represent the sky from your latitude. Planispheres vary in design, but some are intended to work at a certain latitude (for example, 30° North or 40° North), while others are intended to cover a range (for example, 30° to 50° North).
It is better to find a planisphere with a latitude that is near to your own.
To utilize the planisphere, set the correct time and date first and then go outside with a flashlight. (Use a red flashlight; a standard flashlight can dazzle your eyes and impair your night vision.)
Turn the planisphere to the North and flip it so that the North is at the bottom. Your planisphere should then correspond to your view of the sky. If you’re familiar with the Big Dipper, look for it in the sky and on the planisphere (if it’s visible right now) to help you orient yourself.
You can then turn to the east, south, or west and turn the planisphere in your hands again so that the view in the sky corresponds to the view on the star map.
Things to keep in mind and other useful tips:
- The map could very well resemble the leftovers of spilled ink. Take a step back to examine the larger dots. You should have no trouble identifying these brighter stars and constellations.
- If comparing the star chart to the night sky becomes difficult, draw lines on your map so you don’t miss your constellation amid the thousands of visible dots. Once you’ve mastered this, you’ll be able to breeze through these constellations with ease.
- Always begin your search by knowing what you’re looking for, including the correct ascension and declination coordinates. It improves the overall experience and makes it less frustrating. It’s easy to get lost in space, especially when you’re staring through a small eyepiece!
- Once you’ve mastered spotting the brightest stars and constellations on your star chart, try transitioning from bright stars to fainter, more intriguing objects.
- Observe beneath the darkest skies possible, where the large constellations are easily seen. Arm yourself with red LED torches to read your maps in the dark!
FAQs
Will a star chart be useful anyplace on the planet?
Both yes and no. You can buy a star chart and use it anywhere on the planet, but keep in mind that not every star and object is visible from everywhere. For example, Polaris, the North Pole star, is not visible from any place in the southern hemisphere.
Are there various types of star charts?
Astronomers employ various charts depending on how they intend to view them. There are detailed star charts, for example, that show dim stars and objects that astronomers with huge telescopes will utilize. Other star charts only depict objects visible using binoculars.
Which are the best star maps?
The Pocket Sky Atlas from Sky & Telescope magazine is an exceedingly adaptable atlas that can be transported anywhere. In contrast, professional deep-sky viewers will want to use the SkyAtlas 2000.0 by Wil Tirion and Roger W. Sinnot.
Several planispheres are available, but one with black stars on a white backdrop is preferable because it is easier to read in the dark.
At first glance, star charts may appear perplexing – and you may even believe they are unnecessary, given the abundance of smartphone apps that can do the same function. There is, however, nothing quite like understanding the stars and constellations and being able to trace down and find a desired deep-sky object for yourself.
Furthermore, if you use a smartphone, you risk impairing your night vision, and a star chart does not rely on a battery! With this in mind, a planisphere is an excellent tool for learning the constellations, while a star chart is ideal for discovering the treasures contained within it. Have fun searching!